Developing visualizations
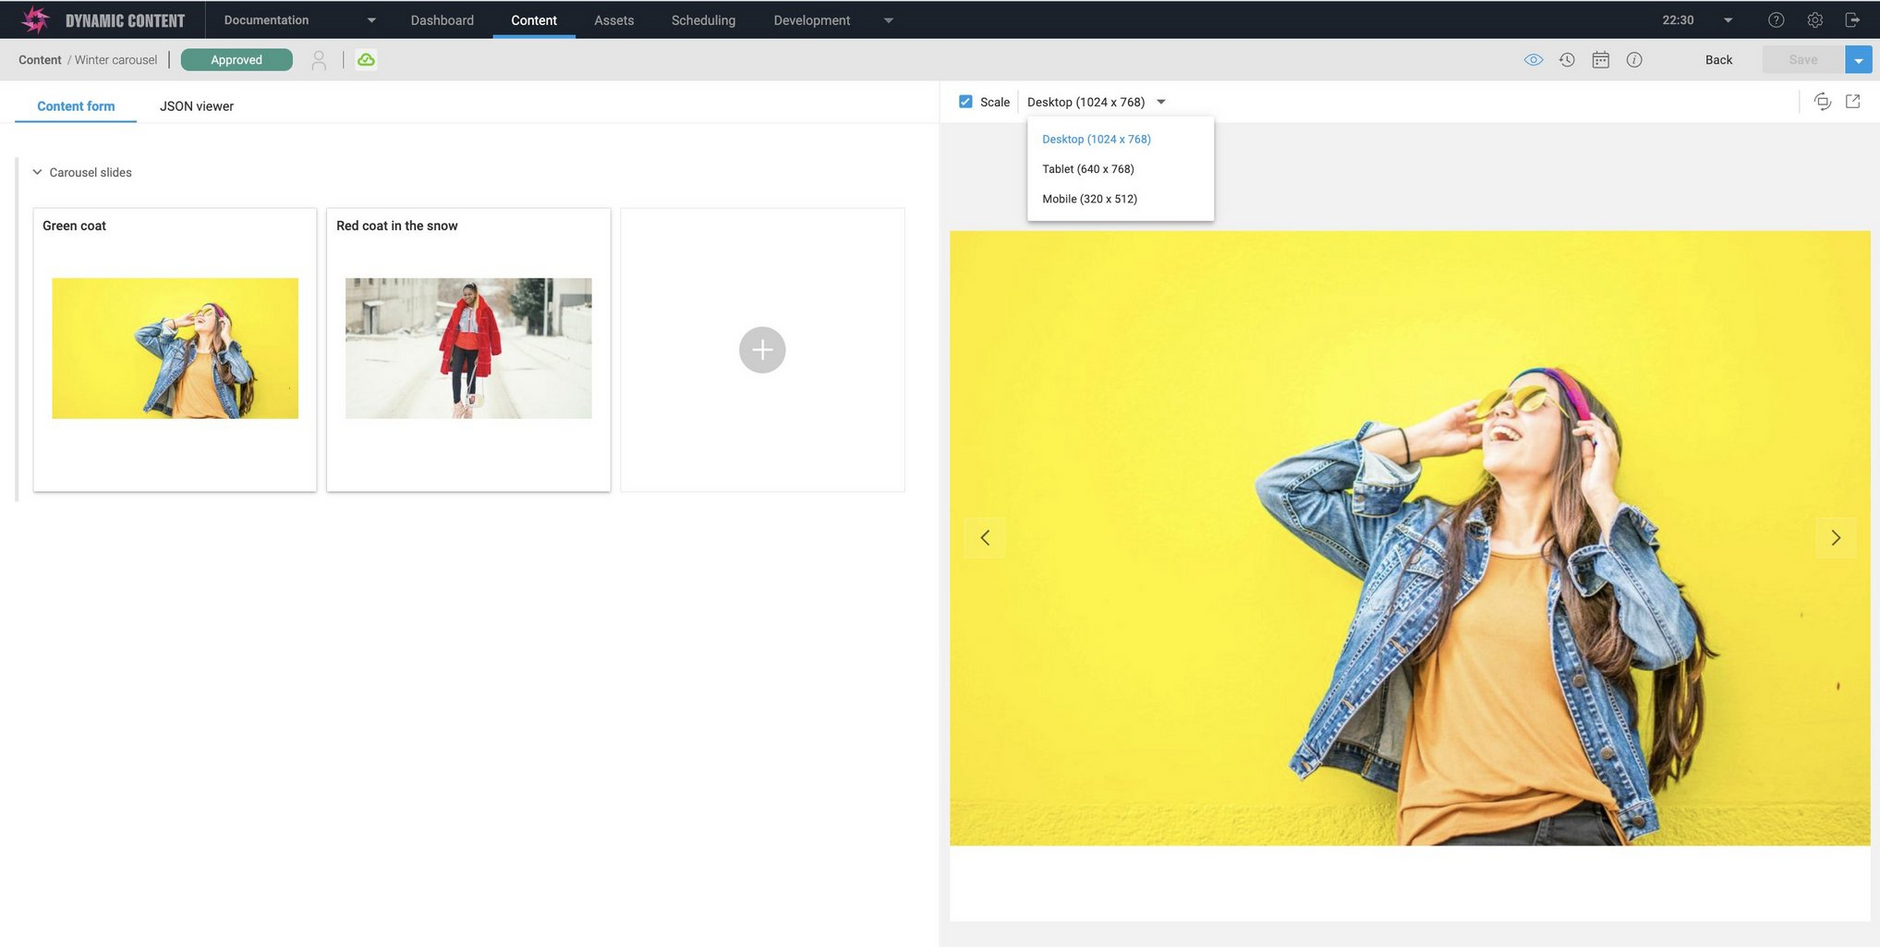
A visualization lets your users preview an individual piece of content by embedding your app in the content editing interface. Dynamic Content tells your app which content item the user wants to view and your app fetches that content and renders it. The visualization is displayed in an iFrame side by side with the content form and can also be shown as a pop out visualization in its own window.
Visualizations overviewLink copied!
Visualizations make use of a virtual staging environment (VSE) to allow you to preview content before it's published. The visualization environment will usually be configured for you at the beginning of your project and can be configured from the "Visualization settings" menu in the Dynamic Content app.
On this page we'll explain how to develop a simple visualization and how to specify it when registering or updating a content type. We'll use the example of the tutorial banner and provide a web app that is designed just to preview content created with that content type.
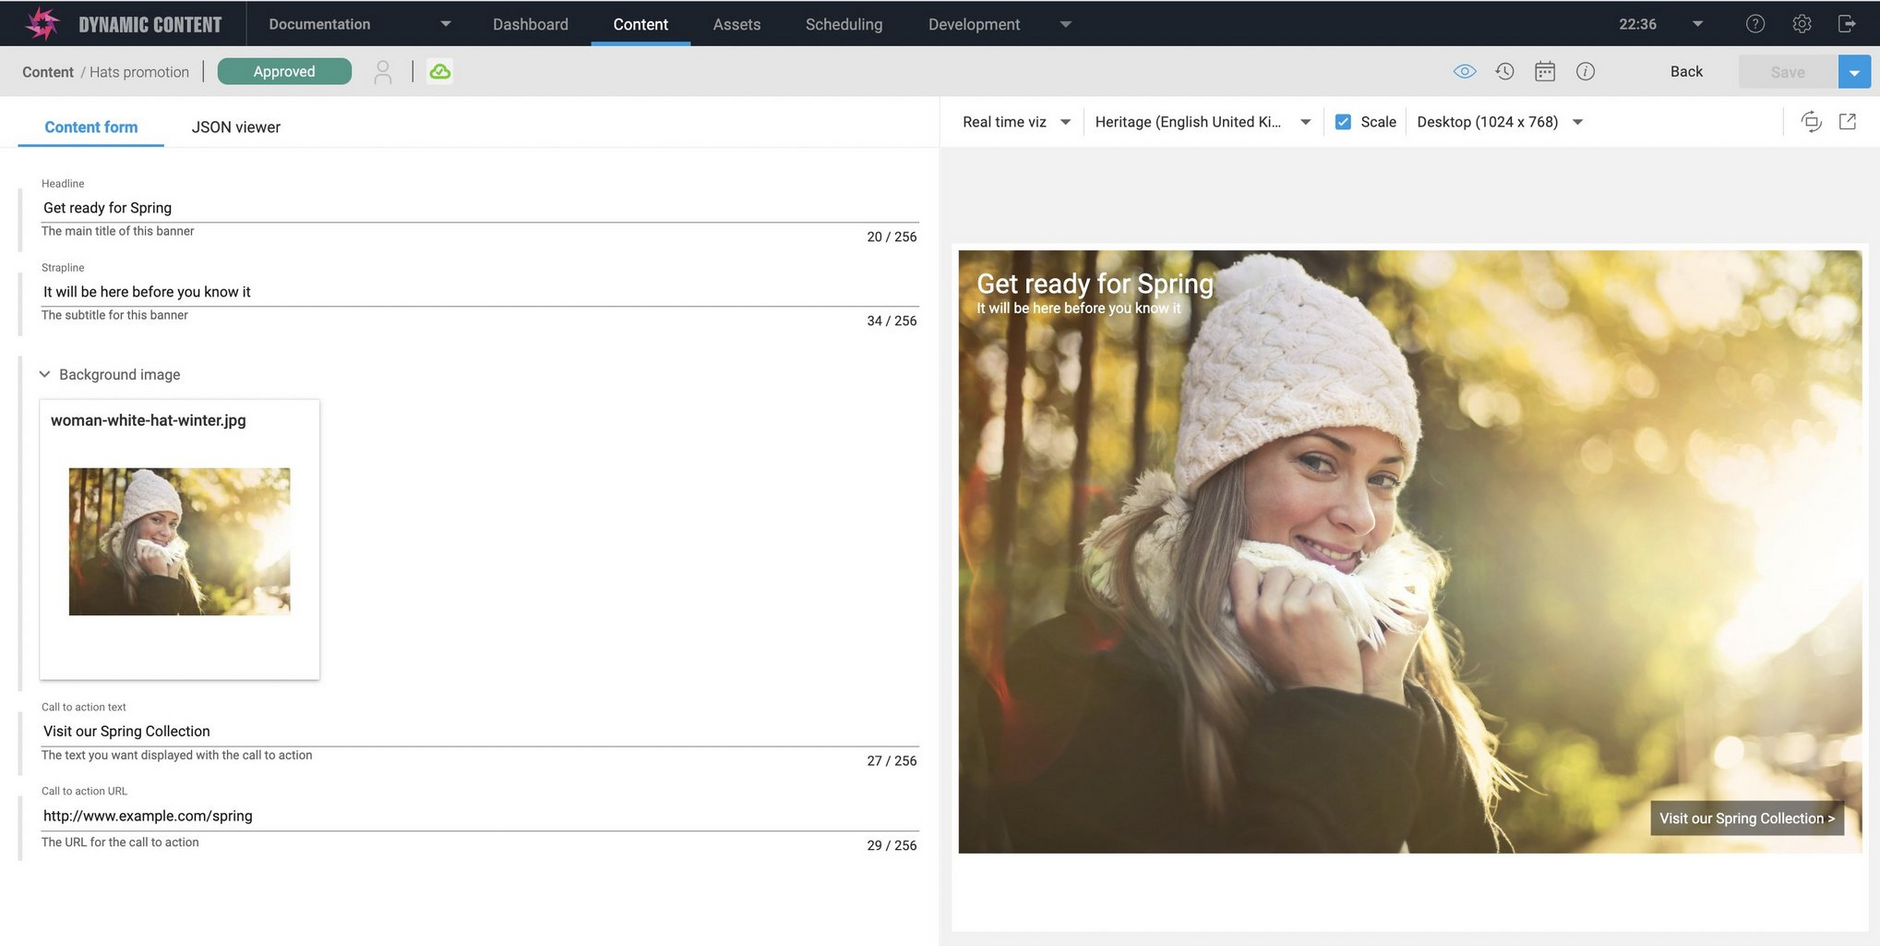
The example below shows the tutorial banner content being previewed in the content form. See the Using visualizations page for more details on how users make use of visualizations to preview a content item. Note that the visualization will only be updated when the user saves the content. Using our new visualization SDK you can develop visualizations that will update as the user makes changes, without having to save the content.
In the realtime visualization section we explain how to use the new visualization SDK to simplify the process of writing a visualization. The SDK allows you to create a visualization that will update as the user makes changes to the content, and we've included a modified version of the banner visualization that uses the SDK. While the SDK takes care of a lot of the details for you, we recommend reading the specifying the visualization for a content type section and taking a look at using the Content Delivery v2 API example to get familiar with visualization concepts.
Pre-requisitesLink copied!
- You must have a virtual staging environment specified in your settings in order to show visualizations for any content.
- The current user's IP address must be in the whitelist of approved IP addresses in order for the visualization to be displayed.
Specifying the visualization for a content typeLink copied!
To add a visualization to a content type, open the "Register content type" window, either when creating a new content type or updating an existing one.
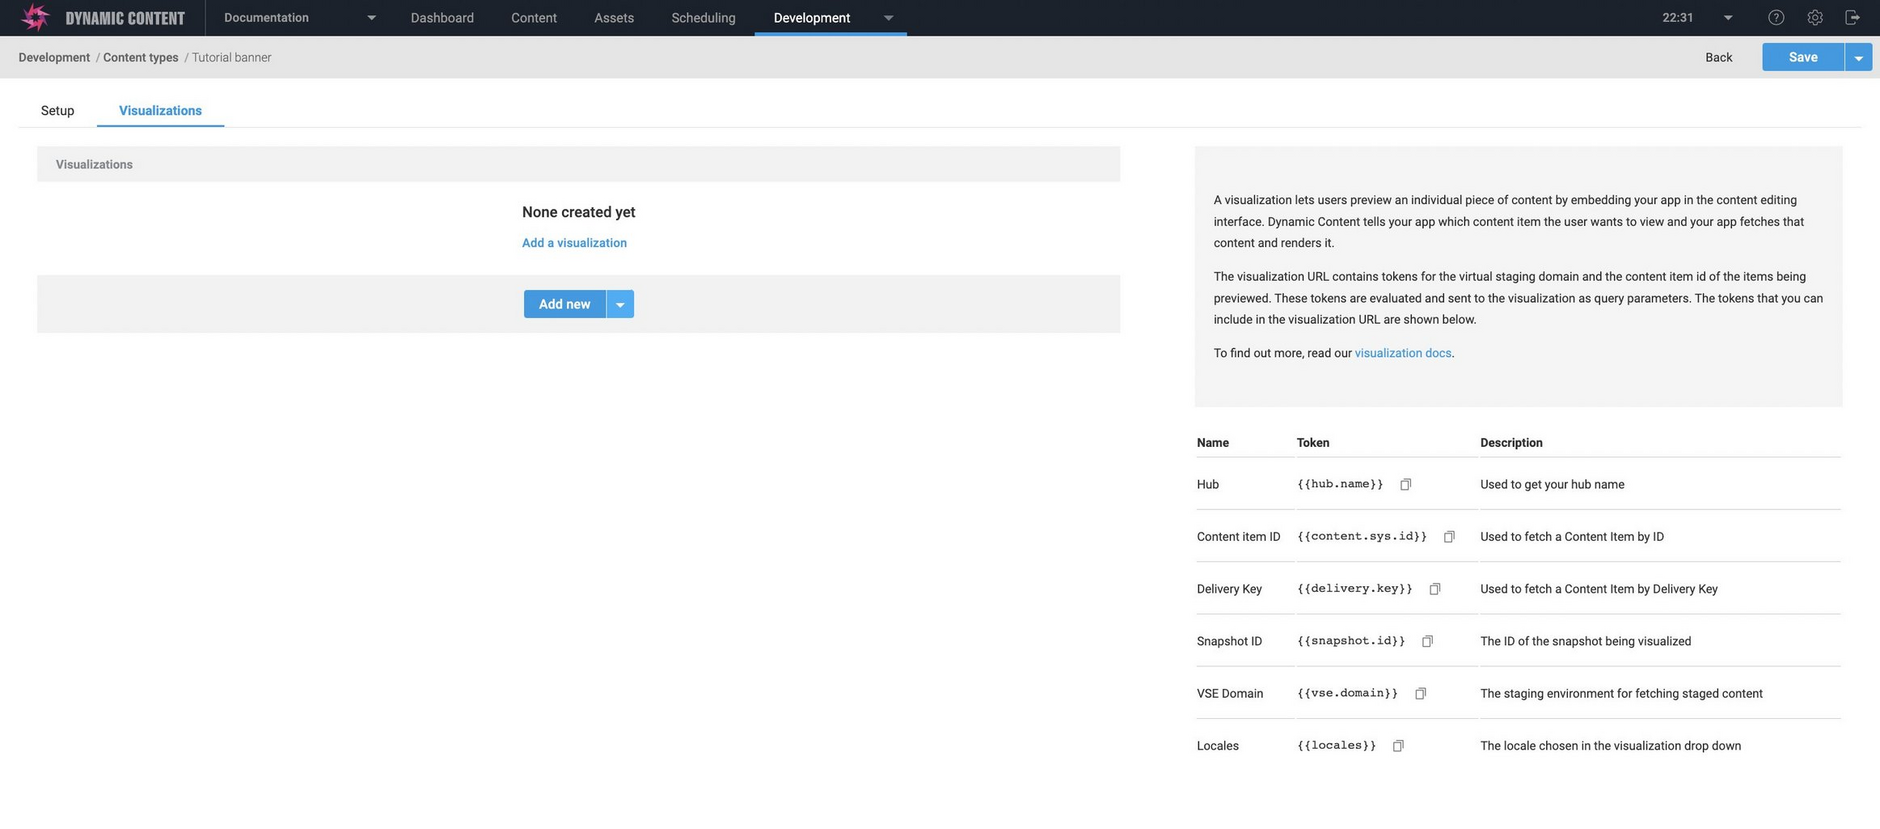
Click the "Visualizations" tab. A list of your visualizations is displayed. To add a new visualization, click the "+" icon.
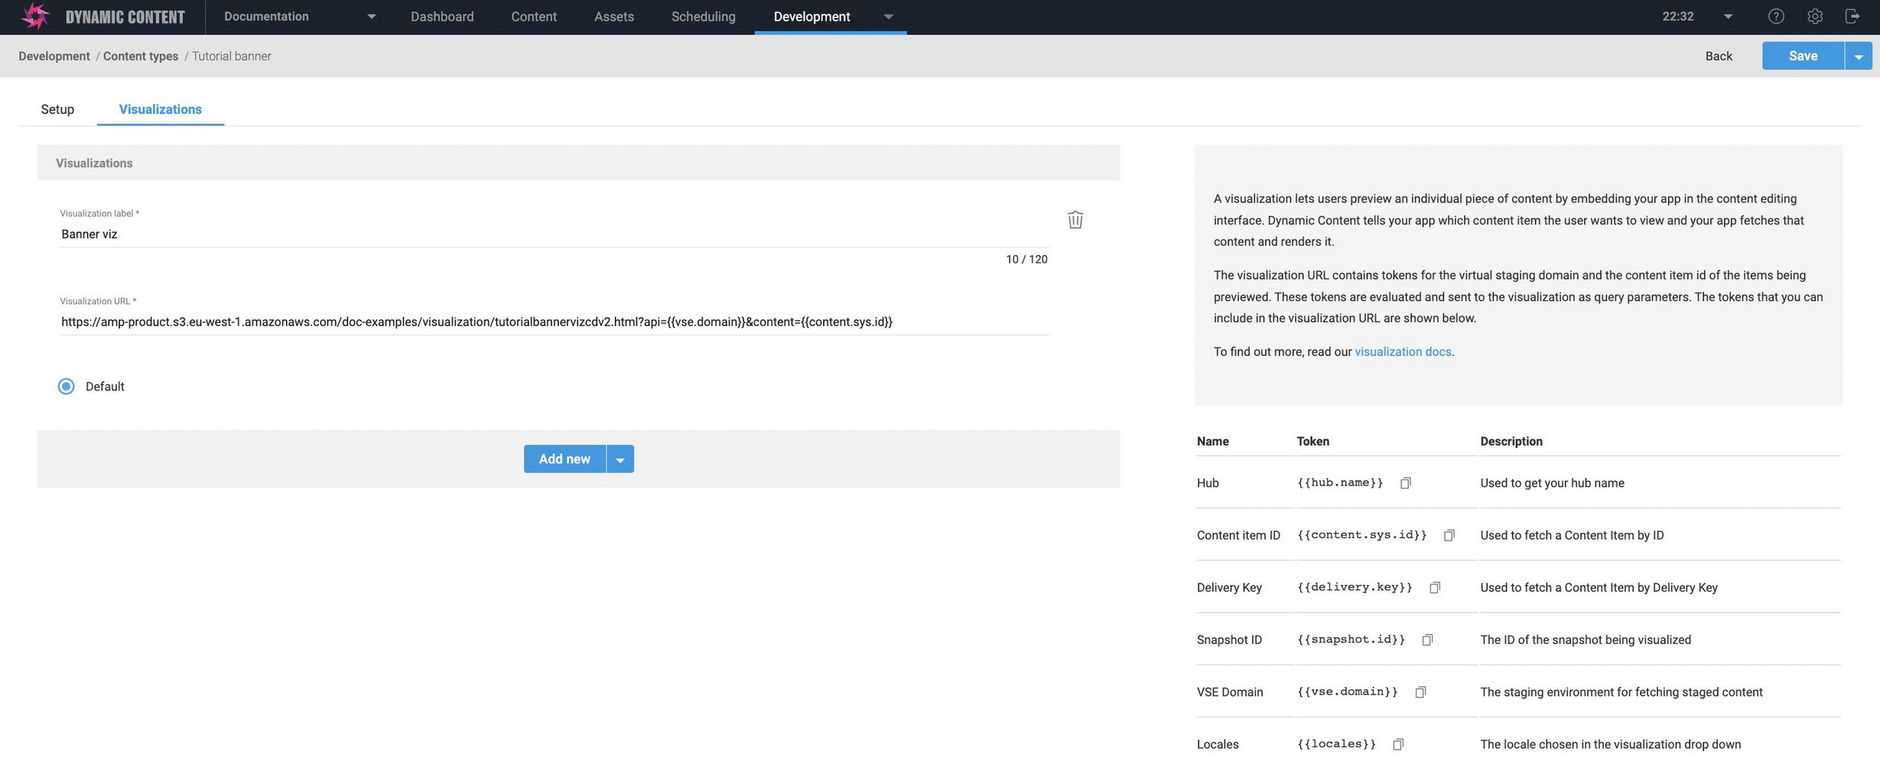
Give the visualization a label. This allows the user to choose this visualization if you've added multiple visualizations to a content type.
In the example below we're giving the visualization the label "banner viz", but you can use what ever you like.
The visualization URLLink copied!
Next enter the templated visualization URL. The URL includes tokens for the id of the content to be visualized and the virtual staging domain. These tokens are evaluated and sent to the visualization as query parameters. You can then use the virtual staging domain and the content id to build up a delivery URL to retrieve the content to be visualized.
When you have finished adding the visualization, if you want to add an additional visualization, click the "+" icon again and fill in the fields.
Here's the templated URL for the tutorial banner example:
The URI the specifies the visualization web app and includes the following templated parameters:
- "api": the VSE domain
- "content": the unique content ID used to retrieve this item from Dynamic Content
Tokens supported by visualizationsLink copied!
The following is a list of the available tokens that you can include in the visualization URL.
{{content.sys.id}}The content id of the content being visualized.{{vse.domain}}The visualization staging domain.{{delivery.key}}The delivery key of the item being visualized. A delivery key is a string of up 150 characters that can be used instead of the content id to retrieve a content item. If no delivery key is assigned to the content then it will be set to null. Note that delivery keys are only supported by Content Delivery v2.{{hub.name}}The current hub name. This is used to retrieve production content using Content Delivery v2. This token is useful if your visualization combines staged and production content.{{locales}}If you support field level localization and include thelocalestoken in your URL, the user selected locale is sent to your visualization as a parameter. You can then retrieve the localized content. See visualizing localized content for a full example.{{snapshot.id}}The id of the snapshot being visualized. This is not usually needed in visualizations. When you view a visualization of a snapshot added to a slot in an edition then the snapshot id is included in the virtual staging domain sent to your visualization so in most cases you don't need to access this directly.
Example 1: Content Delivery v2Link copied!
The section includes the visualization for the tutorial banner content type written using the Content Delivery v2 API. The visualization is for the banner that is used in the get started tutorial.
Retrieving the contentLink copied!
The virtual staging domain and the content ID is used to construct a URL to send to the Content Delivery v2 API to retrieve the content to be visualized. Using the virtual staging domain to retrieve unpublished content is straightforward, you just need to replace the production Content Delivery v2 URL with the virtual staging domain and everything else stays the same.
Here's an example of some code to construct the URL. Note that depth=all and format=inlined are specified as query parameters so that the content and all its dependents will be returned in inlined format.
An example of a complete query URL used to retrieve some content is shown below:
This requests content using the VSE domain kuifkfmrgfsv1qjsmei8dbbnq.staging.bigcontent.io with the ID 8672257c-8f16-42e7-b8cc-14e0a117ba2d
This query is then sent in a GET request to the Content Delivery v2 API. Here's the code used in the tutorial banner example:
Rendering the contentLink copied!
The content is returned from the Content Delivery v2 API in inlined format. In order to render the content in the visualization window you need to do the following:
- Combine the JSON with a handlebars template to generate the HTML to render the content. We use handlebars in the examples
- Combine the HTML with CSS to display the content in the visualization window
Example code to perform these steps from the tutorial banner visualization is shown below.
The handlebars used to render the tutorial banner is shown below.
Complete exampleLink copied!
You can download the complete tutorial banner visualization for Content Delivery v2, including the code shown on this page and the utility methods that you can use in your own code.
Realtime visualizationsLink copied!
The visualization SDK enables you to create realtime visualizations that update as the user changes the content. Users no longer have to save their content before they can see a preview, improving the content creation process. The SDK also simplifies developing a visualization and takes care of a lot of the work for you. You don't have to extract the parameters from the visualization URL or send a request to the Content Delivery API.
Once the SDK is initialized, these are some of the features you can make use of:
Register to receive updates whenever the content form is updated. Your handler will be passed the JSON for the content item in the same format that is returned from the Content Delivery v2 API. You can then use the JSON to update the visualization to show the latest content.
Register to be notified when visualization settings change or the user chooses a new device (desktop, tablet or mobile, for example).
Be notified when the user switches locale. Locale filtering is handled by the SDK, but you may want to do some additional processing when the locale changes.
Be notified when a content item's delivery key is updated.
The delivery preview visualizationLink copied!
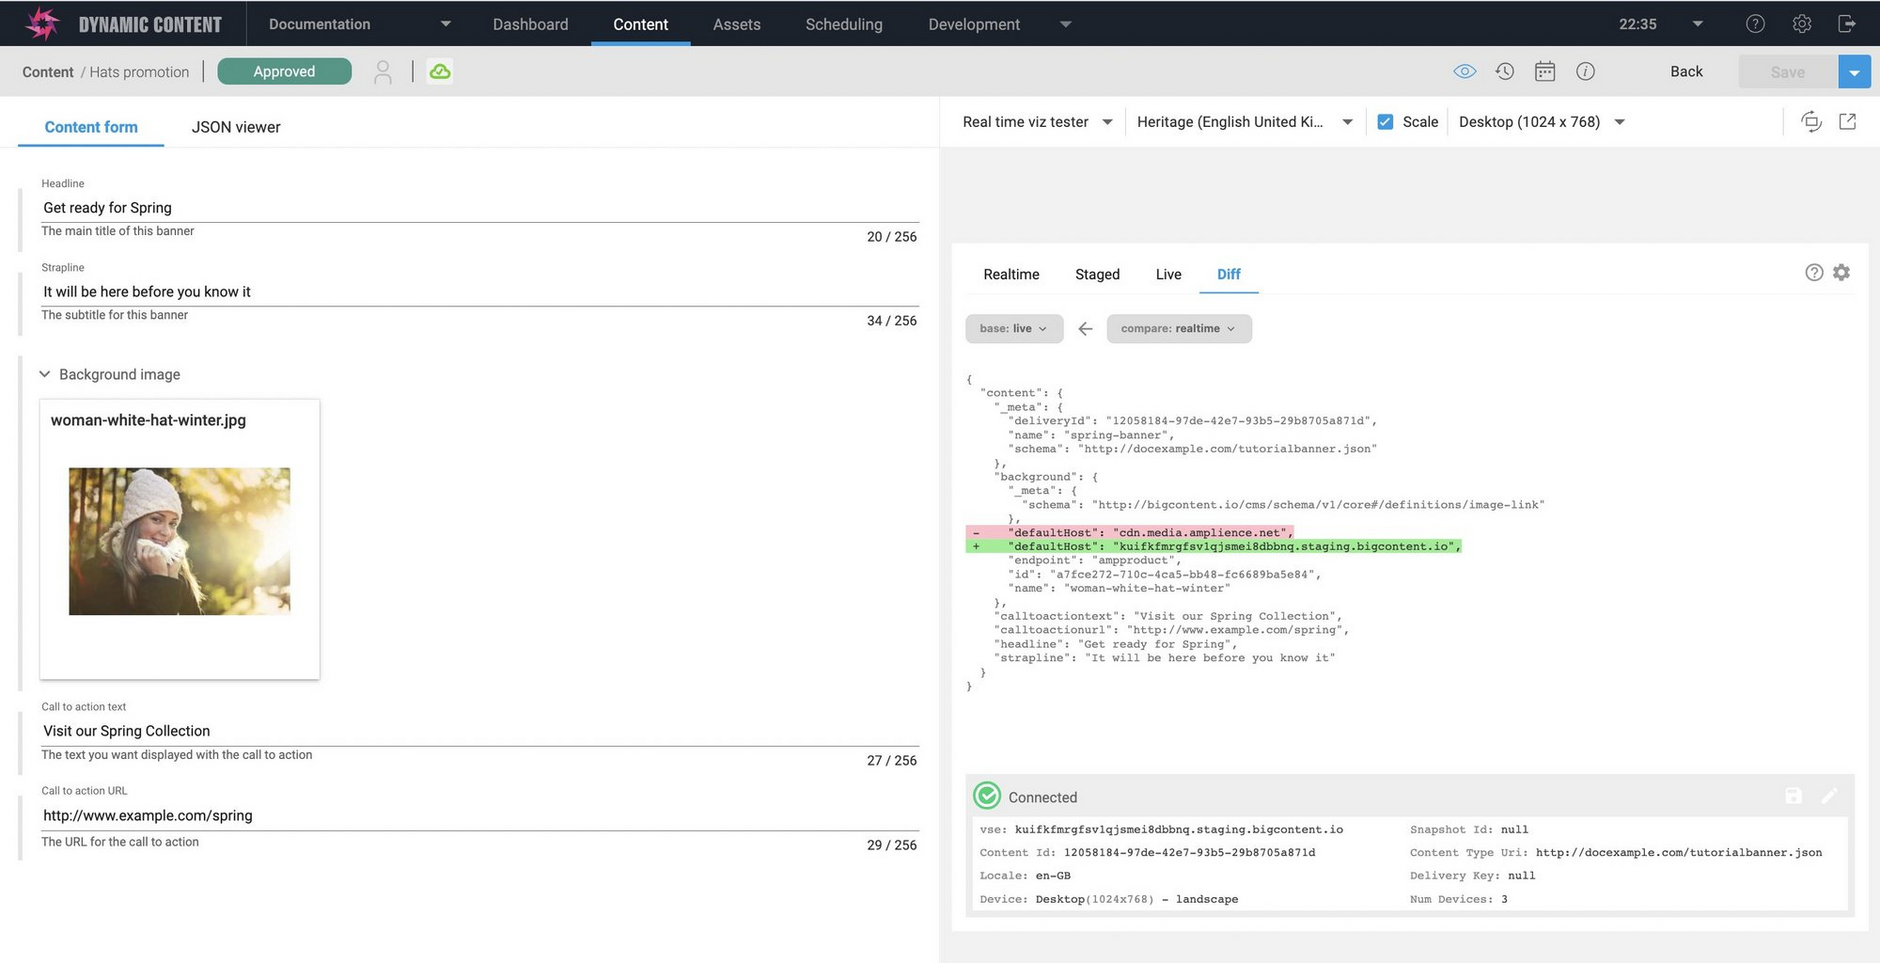
The delivery preview visualization is a hosted visualization that you can use for testing and debugging.
Just add a visualization with the following URL to one of your content types.
The preview can be used to display and compare published, staged (saved content not yet published) and realtime content. In the example below the difference between published and realtime content is highlighted.
Example 2: Using the visualization SDKLink copied!
In this section we'll walk through an updated version of the banner visualization which uses the visualization SDK. This is a very simple example that uses handlebars to render the content in HTML format, but it does show how to use the SDK and the concepts you'll need to know when writing visualizations using frameworks such as React, Vue or Svelte.
Including the SDKLink copied!
Note that this example uses the CDN hosted file of version 2.0.0 of the SDK: https://unpkg.com/dc-visualization-sdk/dist/lib/dc-visualization-sdk.umd.js" to include the visualization SDK. For other ways of using the SDK in your app see the SDK Read Me.
Initializing the sdkLink copied!
To initialize the SDK call the init function. This function will return a VisualizationSDK object that is used to subscribe to events and access the other features of the SDK.
Subscribing to content form updatesLink copied!
In the banner example we want to be notified when the user updates the content form, so we'll subscribe to the form changed event and call our renderContent method when the event is triggered- that is when the user changes the content. The update variable will contain the content item in JSON format, including any changes the user has made in the content form. Because the JSON format is the same as returned by the Content Delivery v2 API, we can use the existing code to render the content.
In order to display the visualization when the window is first opened, we call the sdk.form.get method. This returns the current content form (the content item in JSON format) and we can use that to render the content in the visualization window.
The updated banner visualization code is shown below. Apart from the code we use to render the content, this is all the code needed to implement a realtime visualization that updates as the user makes changes.
Adding realtime=true to the visualization URLLink copied!
In order to enable support for realtime visualizations, you need add realtime=true to your visualization URL. The URL to use for the tutorial banner is shown below.
Visualization SDK usage notesLink copied!
Currently the visualization SDK only supports visualizations displayed in the content form and does not support visualizations displayed in their own pop out window, or in the content and snapshot browser shown when you add content to slots in an edition.
To support visualizations that aren't shown in the content form we recommend the following:
- Include your existing (non-SDK) visualization code as a fallback to be used when the visualization SDK is not available.
- Include the content id, VSE and locales parameters in your visualization URL. While you don't need to include these parameters for a visualization that just uses the SDK, they are needed to implement visualizations that aren't part of the content form.
- The Visualization SDK only supports Content Delivery v2.
Using the realtime visualizationLink copied!
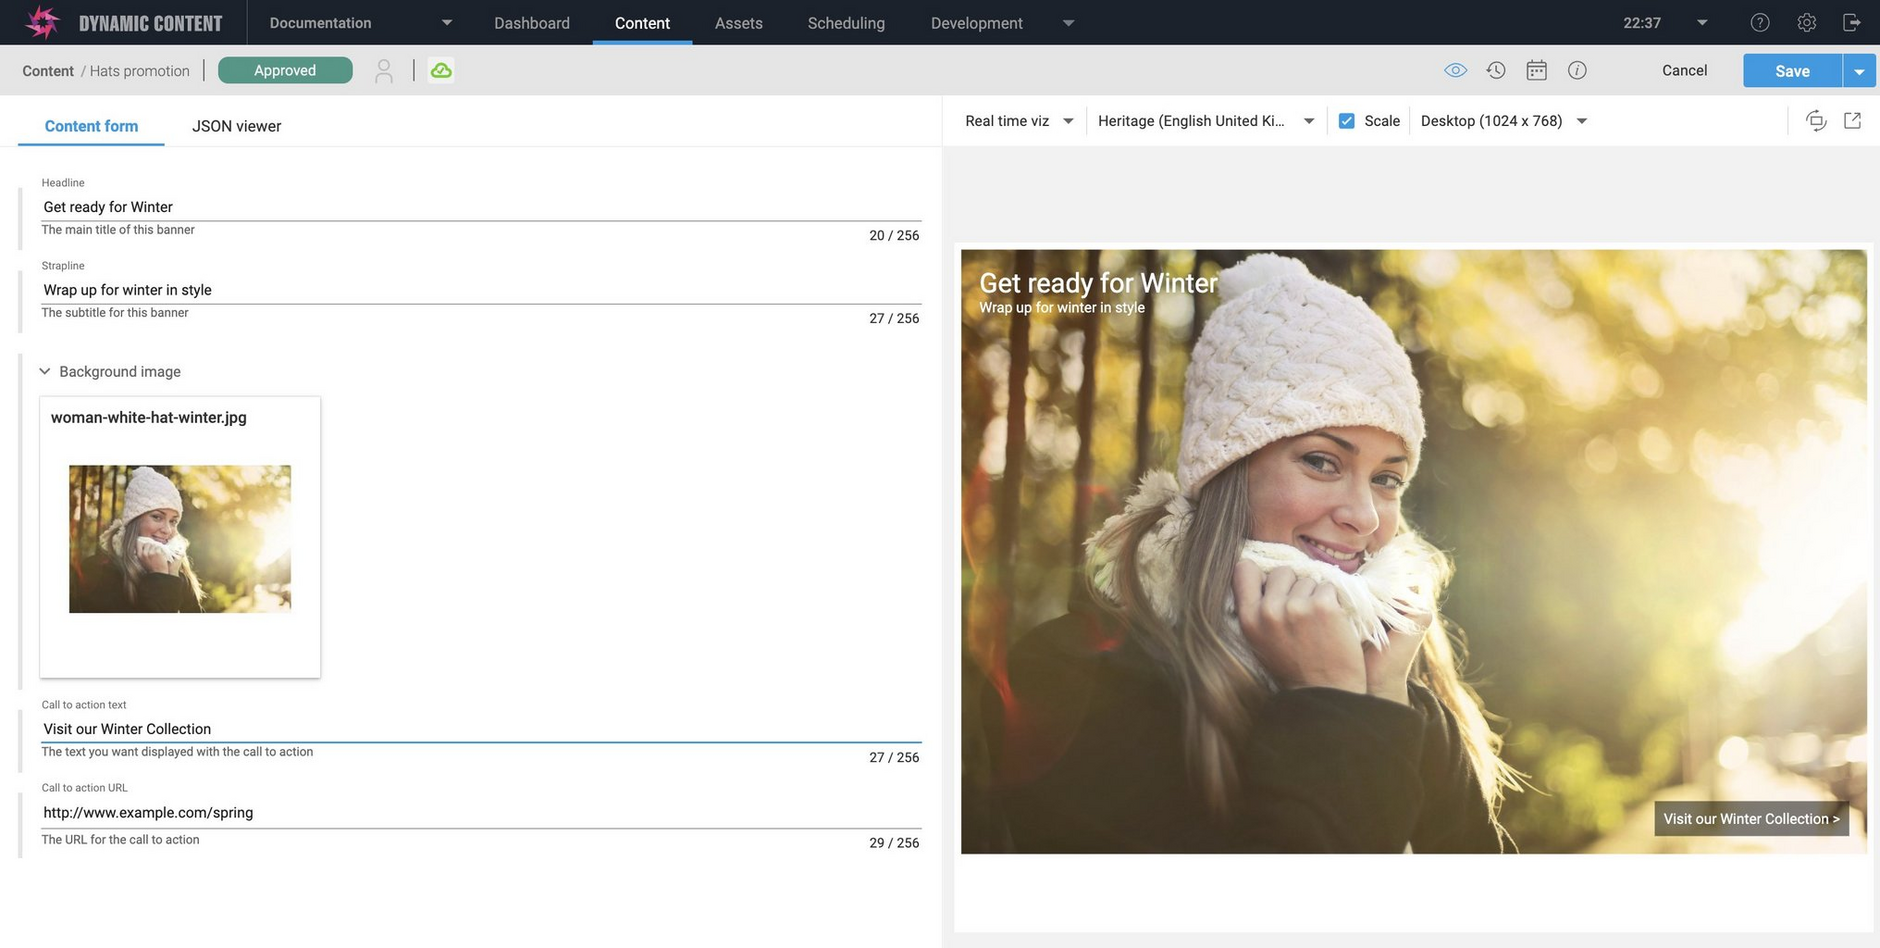
Here's a content item in the content form with the visualization displayed. Note that save button is grayed out because there aren't any unsaved changes.
Now if we update the background image and change the headline text, the visualization is updated without having to save the content. We can make further changes, see the result instantly and then save the content when we're happy with it.
Complete exampleLink copied!
You can download the complete tutorial banner realtime visualization, including the code shown on this page.
Related pagesLink copied!
Blog Post: Preview native apps with Dynamic Content & Appetize.io
