Dynamic Content- The Search Dashboard
Release date: 2nd September 2020
In this release we've introduced the search dashboard, making it easy for users to monitor and improve the effectiveness of their search functionality, and their content, with search analytics.
The search dashboard is available to users of Dynamic Content Search and allows you to determine how well search is working on your website, app or any other channel. It includes the most popular search terms, conversion rates and which terms users were searching for that returned no results.
On this page we'll give you a quick overview of the new search dashboard. For more information visit the search dashboard page and the Dynamic Content Search page.
Using the search dashboardLink copied!
When you have Dynamic Content Search enabled on a hub, two tabs will be now shown at the top of your dashboard: "content" and "search". The "content" tab is where you'll find widgets showing usage of your content items and editions. You can find out more about these widgets on the dashboard page.
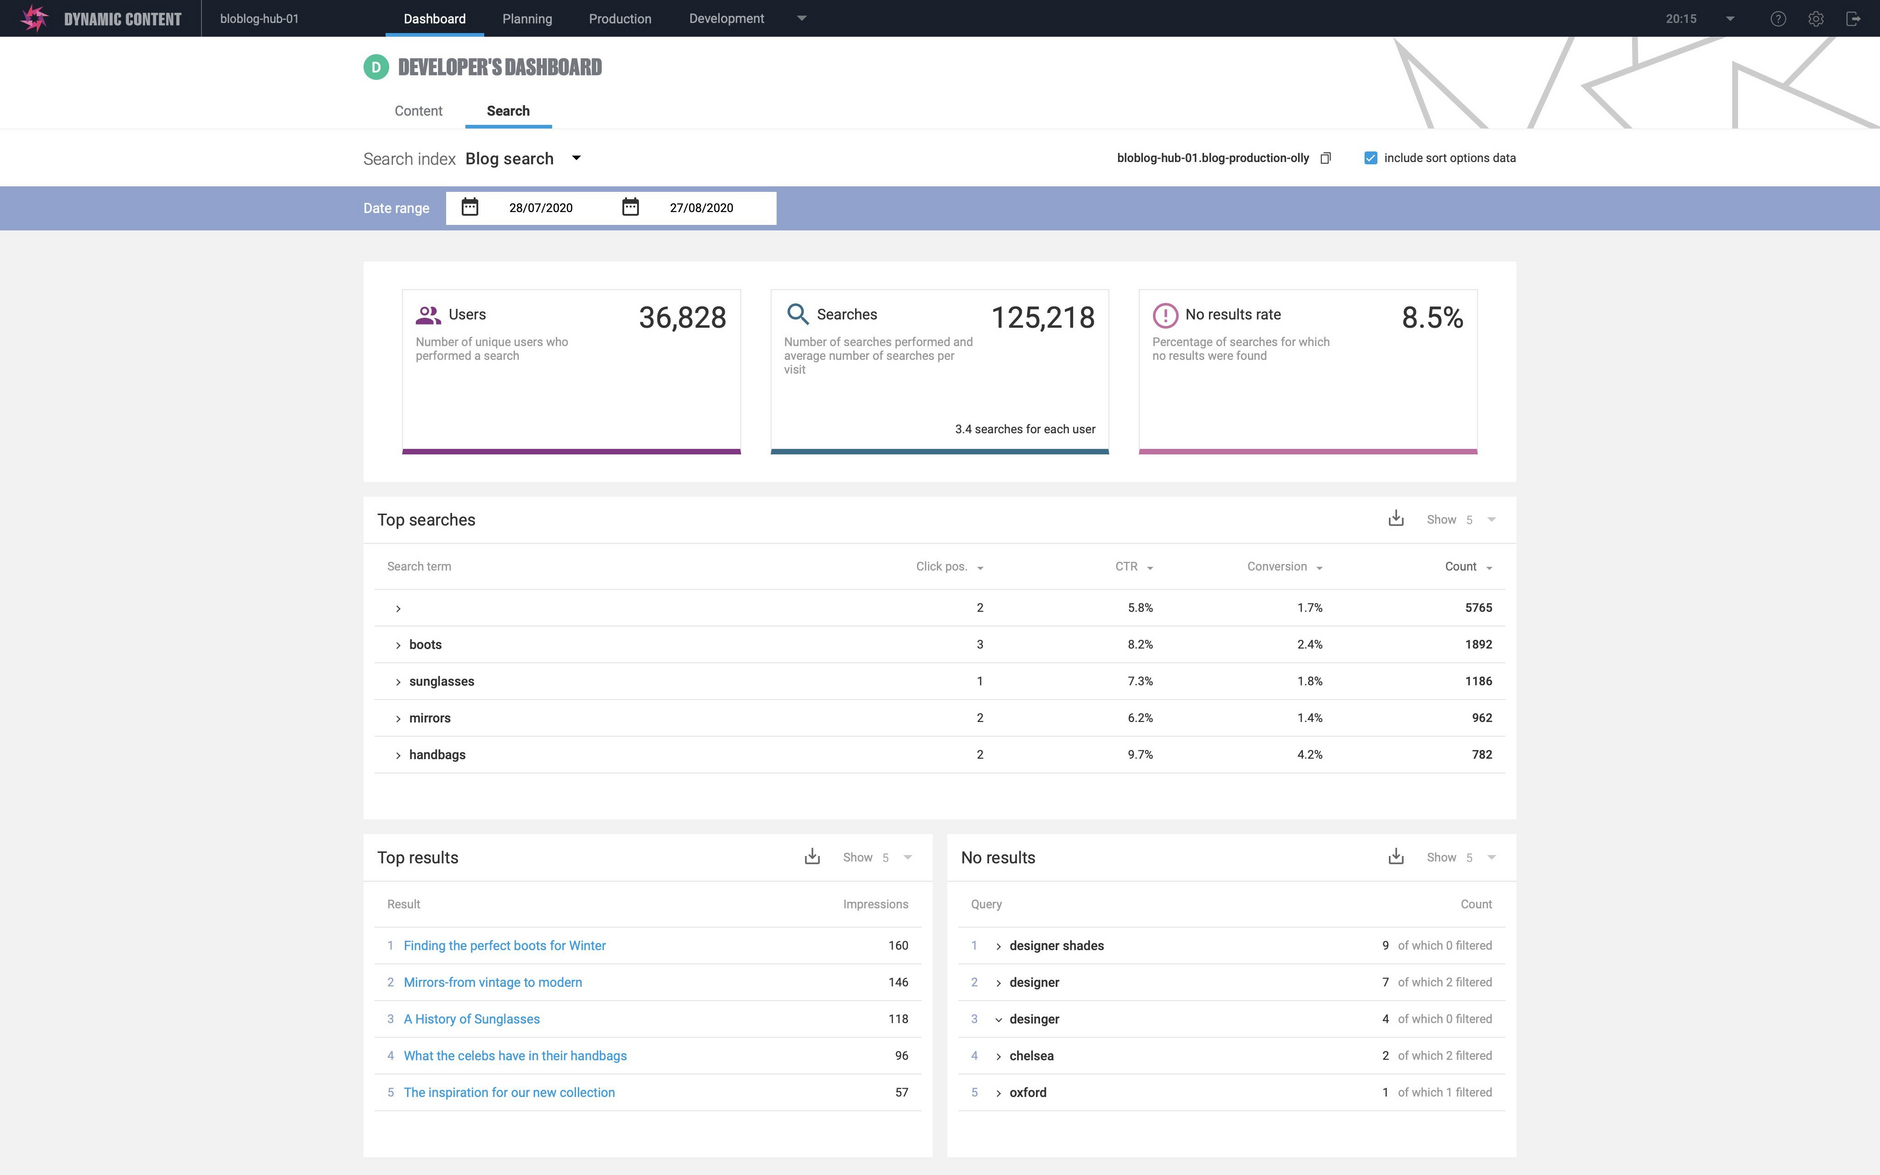
Under the search tab you'll find the search analytics widgets: overview, top searches, top results and no results.
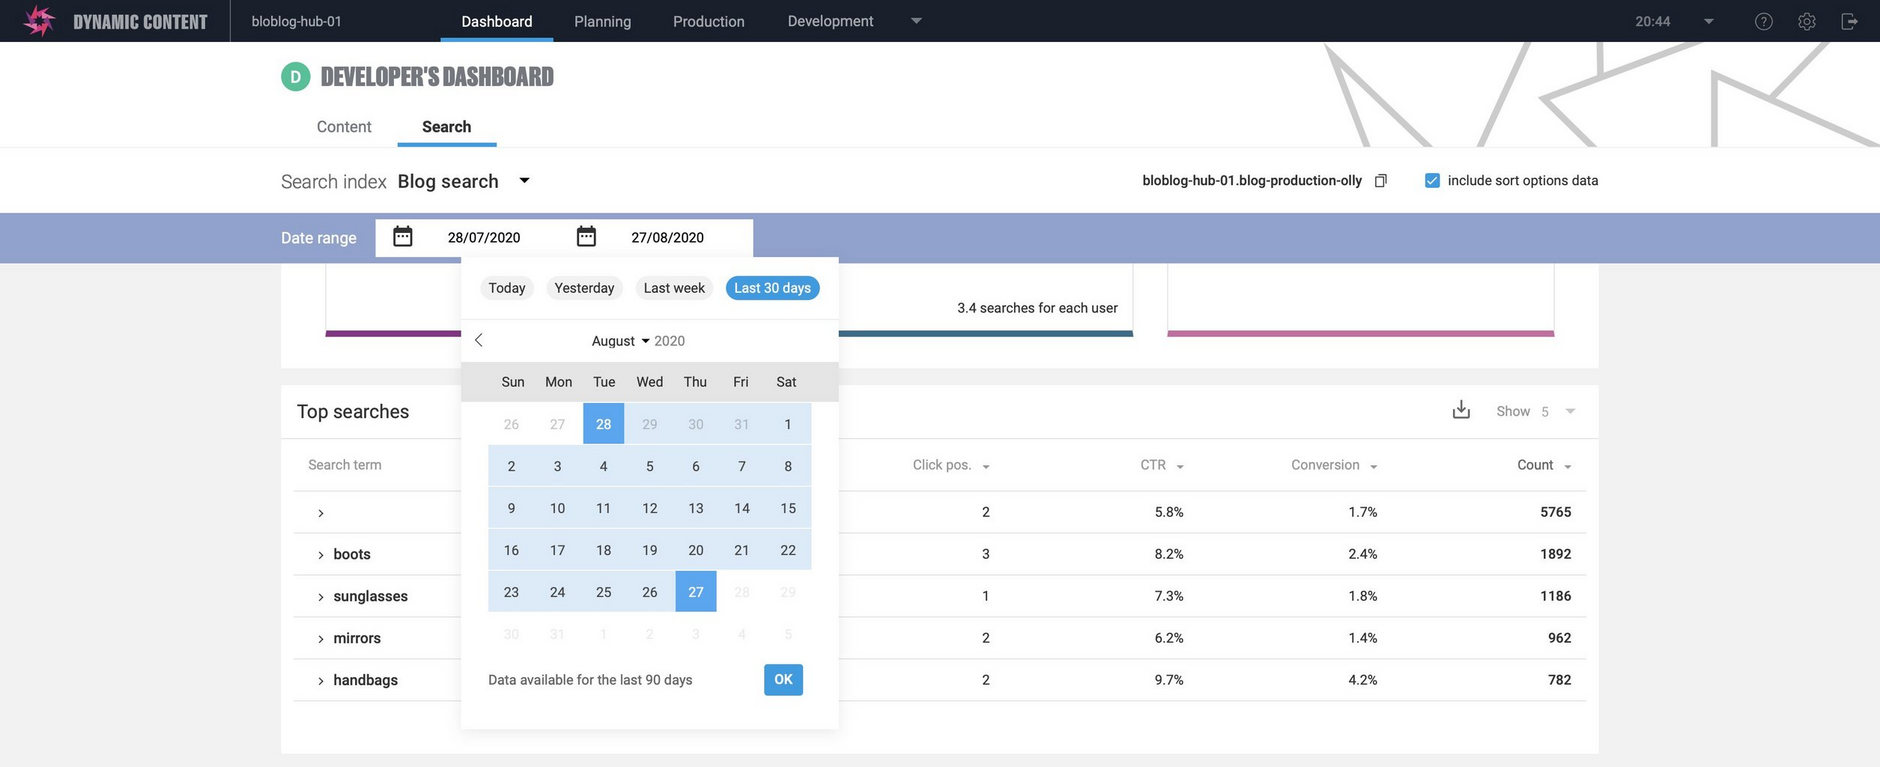
To use the dashboard you first need to select the index you want to view analytics for and choose a date range. To choose the date range for the analytics data you must pick a start date and an end date in the date picker. Click on the current date range to open the date picker and click a day in the calendar to choose the start date, then click on another day to choose the end date and finally click OK. We've included a few shortcuts to show today, yesterday, last week or the last 30 days.
The example used on this page is a blog on a website that tracks clicks on each blog and is configured to measure product conversion from within the blog content.
The search analytics overview widgetLink copied!
The first widget displays some key performance indicators to help you understand search user behaviour for the selected index in the selected time period.
It shows:
- Number of users. This is the number of unique users who use search for this index.
- Searches. This is the total number of searches performed during the selected time period. The average number of searches per user is also shown.
- No results rate. This is the percentage of searches that returned zero results. If this is a significant percentage of your searches then this helps you identify a poor user experience. This is a great way to identify gaps in your content.
The top searches widgetLink copied!
In the top searches widget you'll find information about the most common search terms during the selected time period.
You can choose to display the top 5, 10 or 25 search terms or download the entire list of search terms as a CSV file (up to 1000 are stored).
For each term the following information is shown:
- Click position. This is the average position of each result for that query. The lower the number the better, since this implies that the user didn't have to scroll too much to find the result they wanted.
- CTR (Click through rate). This is the percentage of people who actually clicked on a result following a search.
- Conversion rate. This might refer to the percentage of times a user clicked on a product details page from a blog, or when doing a product listings search it could be linked to an "add to basket" button.
The top results widgetLink copied!
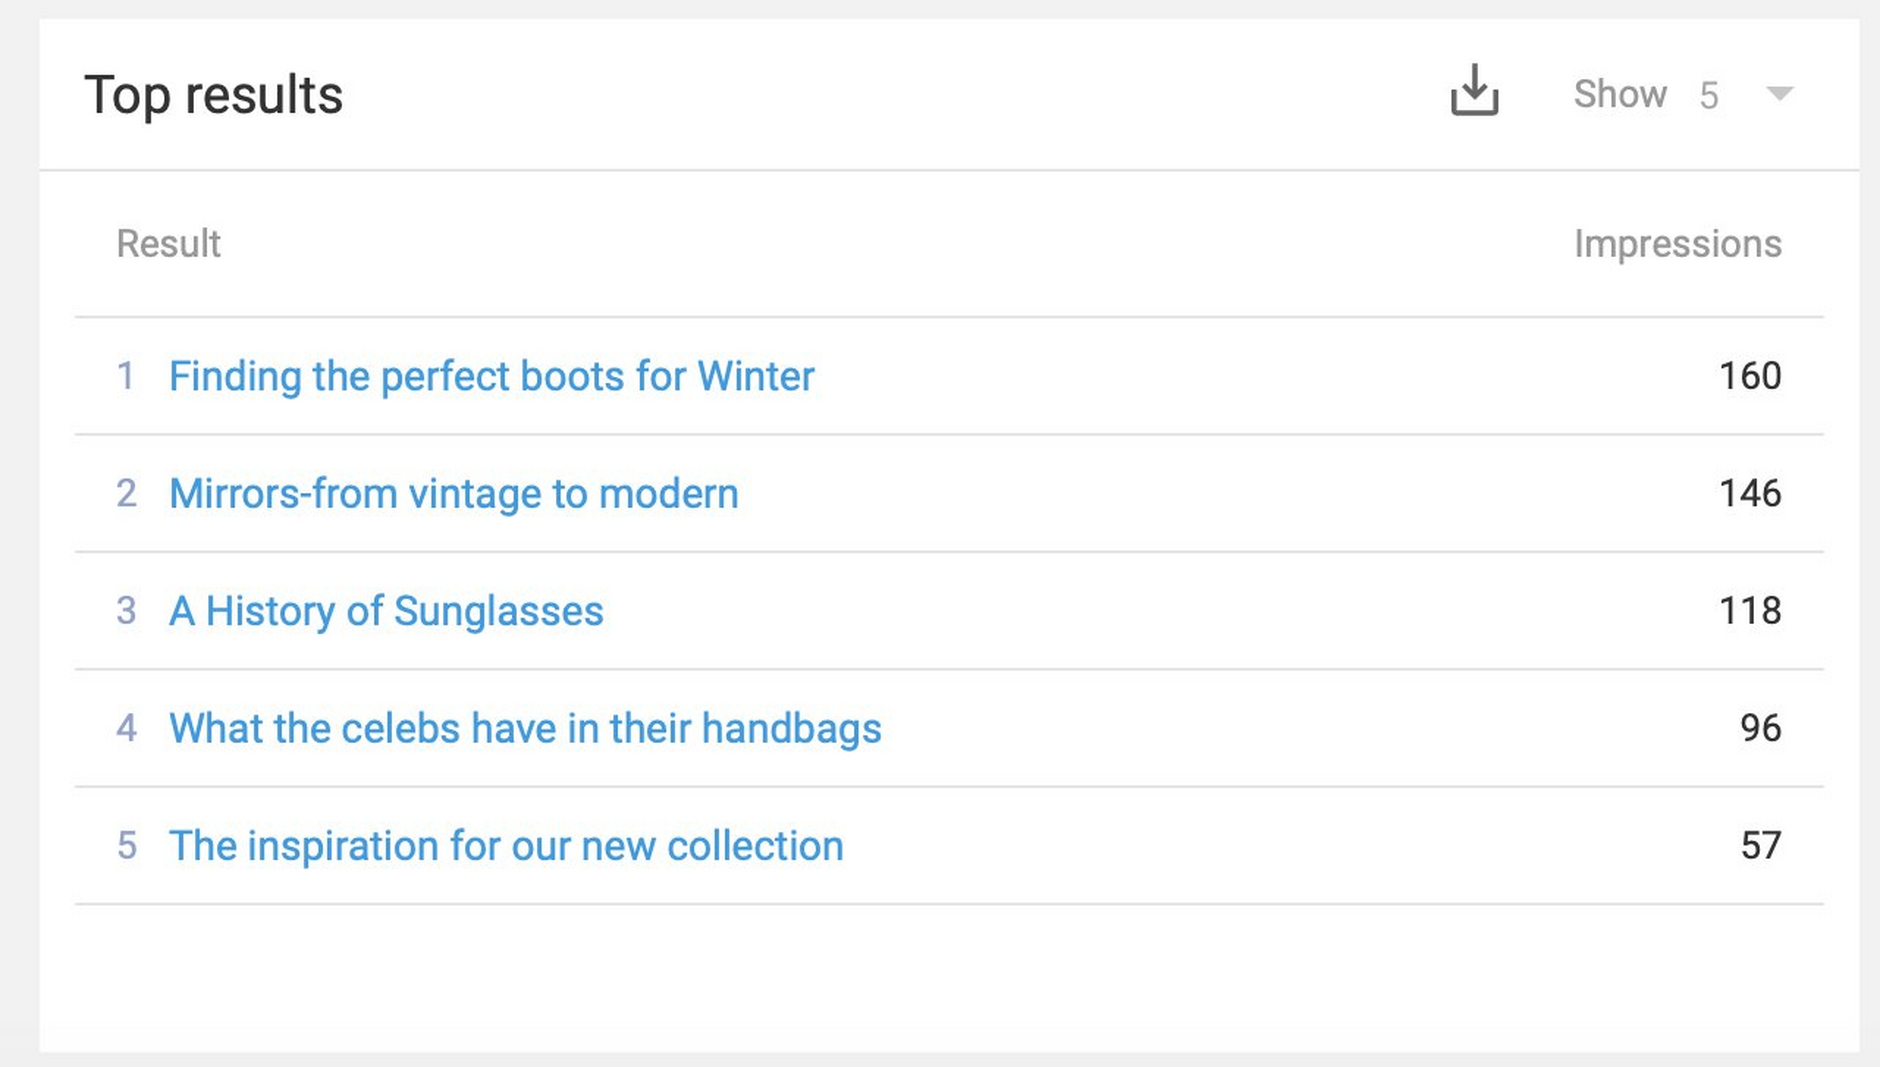
The top results widget displays the top 5, 10 or 25 results across all searches. These are the most commonly returned results, rather than the most clicked on.
The No Results WidgetLink copied!
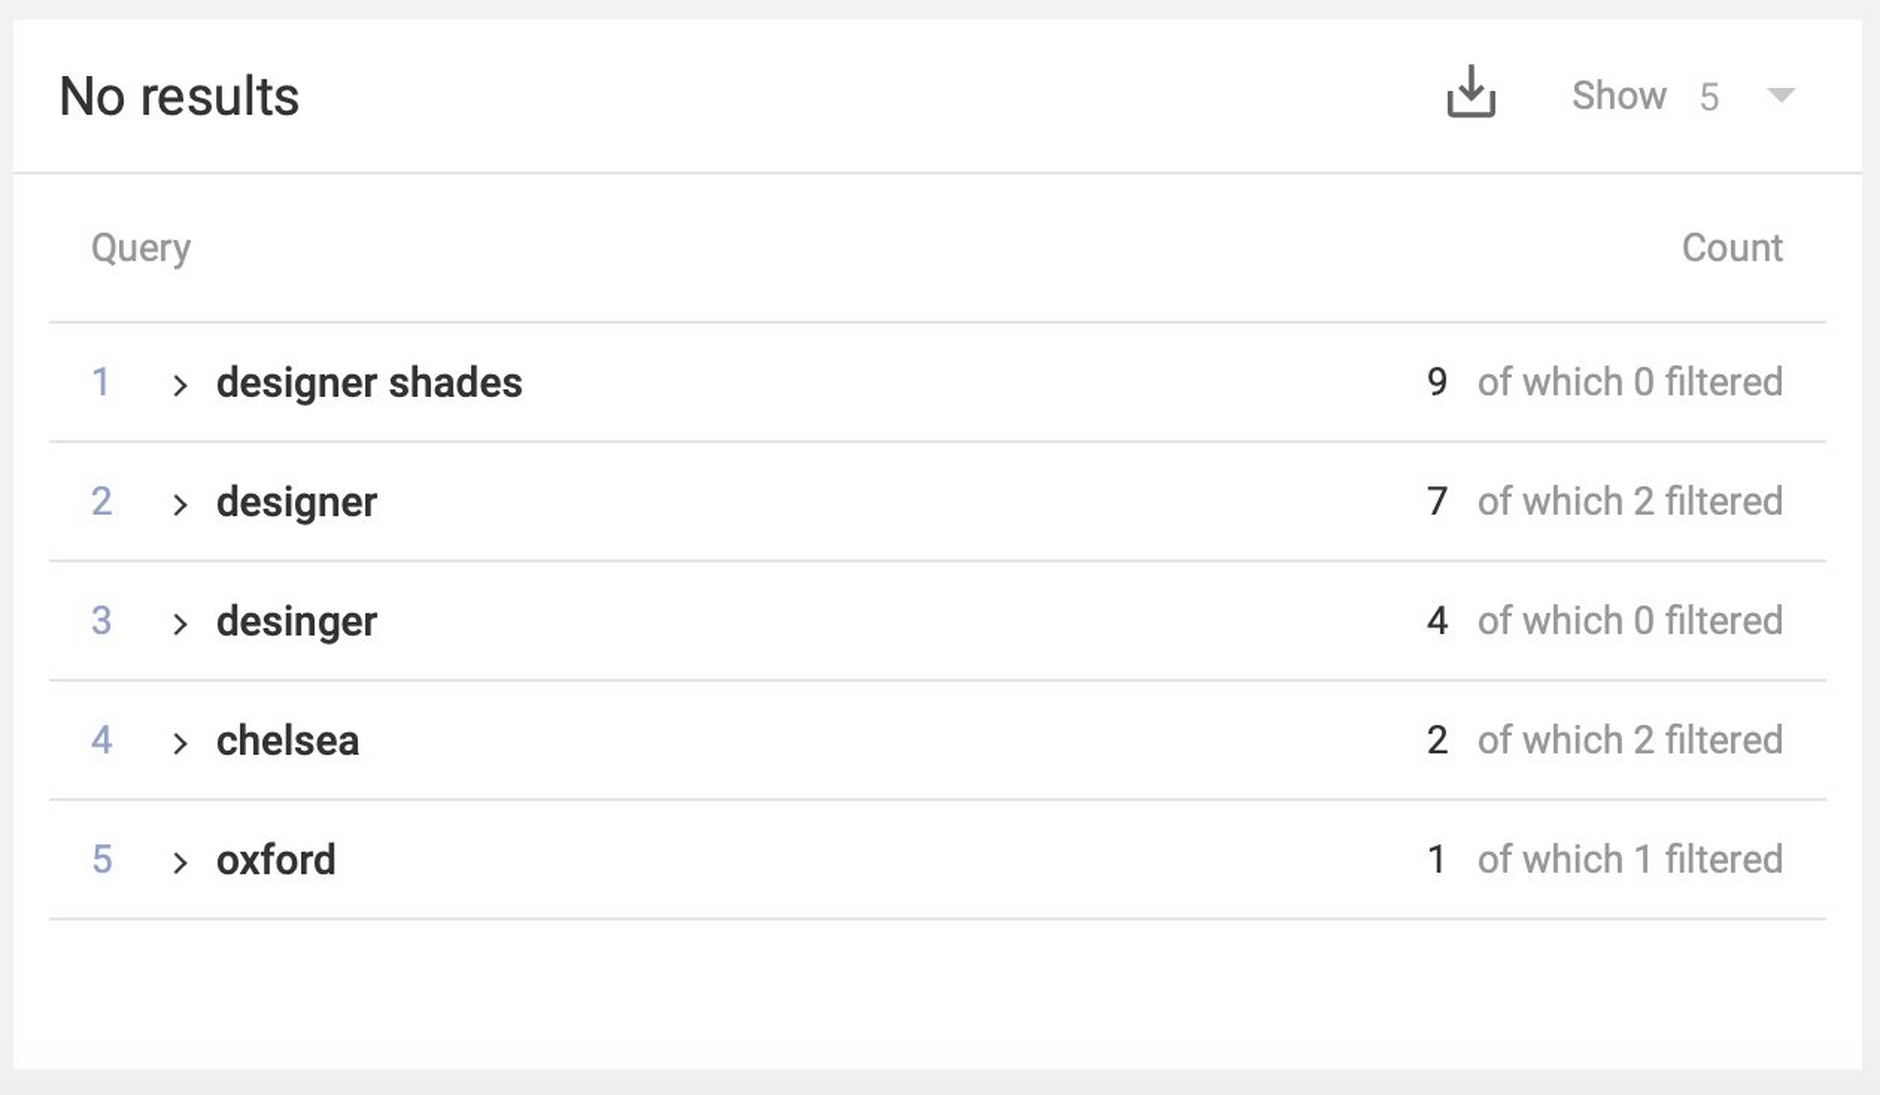
The no results widget shows the most common search queries that returned zero results. These might be misspelled terms or just terms for which no related content can be found. The number of times each search query was used is displayed, together with a count of filtered searches. This indicates a search that was performed with a facet selected.
The no results widget is useful for content managers who can plan new content for commonly used search terms that currently return no results, or add facet values to existing content.


